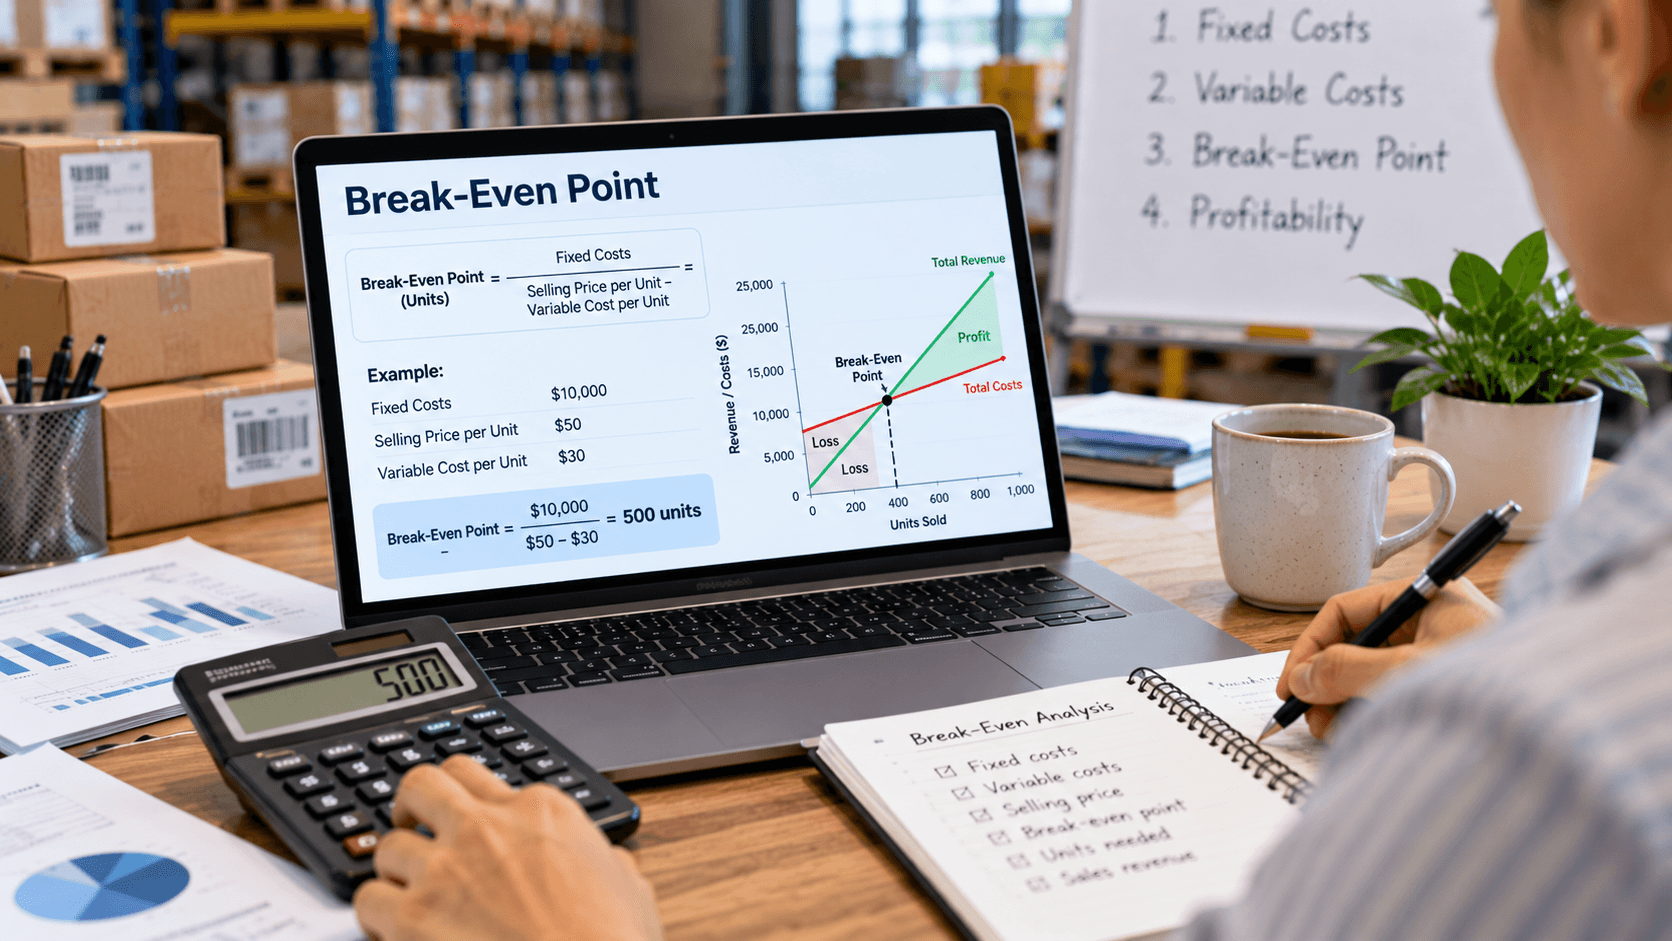
The break-even point formula calculates how many units a business must sell, or how much revenue it must generate, to cover its total costs. At the break-even point, total revenue equals total expenses within the model, meaning operating profit is zero. Sales above that threshold can generate profit, while sales below it produce losses, assuming the underlying cost and pricing relationships remain valid.
The break-even point formula is valuable for evaluating product prices, startup plans, expansion decisions, and sales targets. A new business can use it to estimate the minimum monthly volume needed to support operations. An established wholesaler can calculate whether adding a warehouse, expanding deliveries, or introducing a product line is financially justified.
Break-even analysis is a planning model rather than a guarantee. It typically assumes a known selling price, measurable variable costs, and fixed expenses that remain stable within a relevant operating range. Businesses must update the calculation when these assumptions change.
What Is the Break-Even Point Formula?
The break-even point formula divides fixed costs by contribution margin per unit to calculate the number of units required to cover all modeled costs. Contribution margin is the selling price minus variable cost per unit. Each unit sold contributes that difference toward paying fixed expenses.
Break-even point (units) = Fixed costs ÷ (Selling price per unit − Variable cost per unit)
Suppose a distributor has monthly fixed costs of $18,000, sells a product for $50, and incurs $30 in variable costs per unit. Its unit contribution margin is $20.
Break-even quantity = $18,000 ÷ $20 = 900 units.
The company must sell 900 units during the modeled month to break even. At 900 units, revenue equals $45,000, variable costs equal $27,000, and fixed costs equal $18,000.
How to Calculate Break-Even Point Step by Step
Calculating the break-even point requires identifying fixed costs, estimating variable cost per unit, and determining the expected selling price. All three inputs must cover the same period and business activity. Mixing annual fixed expenses with monthly unit sales without adjustment produces an invalid result.
Step 1: Identify Fixed Costs
Fixed costs generally remain unchanged across a relevant range of sales volume during the selected period. Examples can include warehouse rent, salaried administration, fixed software subscriptions, insurance, and certain equipment costs. These expenses still exist even when sales volume is lower than expected.
Fixed does not mean permanent. A business may need another warehouse or supervisor when volume exceeds capacity. Break-even analysis should account for these step changes rather than assuming expenses remain flat indefinitely.
Step 2: Calculate Variable Cost per Unit
Variable costs change with the quantity sold or produced. In a wholesale business, they may include product acquisition costs, unit-based packaging, commissions, and fulfillment charges that vary directly with units or orders. Relevant freight expenses should be classified based on how they behave within the model.
Suppose a product sells for $80 and incurs $46 in merchandise cost, $4 in variable handling and transportation, and $2 in variable sales costs. The total variable cost is $52 per unit, leaving a $28 contribution margin. This is the amount available to cover fixed costs before generating operating profit.
Step 3: Calculate Contribution Margin
Contribution margin measures sales revenue remaining after variable costs. It differs from gross margin because the classification of expenses is based on cost behavior, not merely their placement in the income statement.
Contribution margin per unit = Selling price − Variable cost per unit
Contribution margin ratio = Contribution margin per unit ÷ Selling price
If price is $80 and variable cost is $52, the unit contribution is $28 and the contribution margin ratio is 35%.
Step 4: Divide Fixed Costs by Contribution
Assume monthly fixed costs are $28,000. Using the $28 unit contribution, the break-even point is $28,000 ÷ $28, or 1,000 units.
At 1,000 units, the business generates $80,000 in revenue and incurs $52,000 in variable costs. The $28,000 contribution covers the $28,000 fixed cost total. Modeled operating profit is zero.
Step 5: Compare Break-Even Sales With Demand
A calculated threshold is useful only when sales volume is realistic. If the market can support 1,400 monthly units, a 1,000-unit break-even point may leave a potential operating cushion. If expected demand is only 600 units, the business needs to change its operating assumptions or reconsider the offering.
Demand forecasts, seasonality, customer purchasing commitments, and competition should all be considered. Break-even analysis tells the company what must happen financially; it does not prove that customers will purchase the required quantity.
Break-Even Point Formula in Sales Dollars
The break-even point in sales dollars is calculated by dividing fixed costs by the contribution margin ratio. This approach is useful when managers plan revenue targets instead of unit quantities. It can also support multi-product businesses when a reliable blended contribution margin ratio is available.
Break-even revenue = Fixed costs ÷ Contribution margin ratio
Suppose monthly fixed costs are $30,000 and the contribution margin ratio is 25%.
Break-even revenue = $30,000 ÷ 0.25 = $120,000.
The company needs $120,000 in modeled sales revenue to cover its fixed and variable costs. This assumes the contribution margin ratio remains at 25% across the relevant sales range.
Break-Even Point Calculation Example for a Distributor
A distributor's break-even calculation must consider merchandise costs and the additional expenses associated with fulfilling commercial orders. The following hypothetical example models a company selling one standardized product.
At 1,500 units, the distributor earns a total contribution of $45,000, exactly enough to cover fixed costs. If it sells 1,800 units under the same assumptions, contribution becomes $54,000. Operating profit in the simplified model rises to $9,000.
That additional profit is not automatically cash received. If business customers pay in 30 or 60 days, the company must still finance merchandise purchases and operating expenses while waiting for payment.
| Monthly operating input | Value |
|---|---|
| Selling price per unit | $100 |
| Merchandise cost per unit | $60 |
| Other variable expenses per unit | $10 |
| Total variable cost | $70 |
| Contribution per unit | $30 |
| Fixed operating costs | $45,000 |
| Break-even quantity | 1,500 units |
| Break-even revenue | $150,000 |
Break-Even Analysis Table at Different Sales Levels
A break-even analysis table shows how operating results change as sales volume increases or decreases. Holding price, variable unit cost, and fixed expenses constant allows owners to identify the impact of each additional unit.
Each unit above break-even contributes $30 toward operating profit as long as the modeled price and costs remain unchanged. In real operations, additional staffing, warehouse capacity, or discounted pricing can change this relationship.
| Units sold | Revenue | Variable costs | Fixed costs | Operating profit |
|---|---|---|---|---|
| 1,000 | $100,000 | $70,000 | $45,000 | −$15,000 |
| 1,250 | $125,000 | $87,500 | $45,000 | −$7,500 |
| 1,500 | $150,000 | $105,000 | $45,000 | $0 |
| 1,750 | $175,000 | $122,500 | $45,000 | $7,500 |
| 2,000 | $200,000 | $140,000 | $45,000 | $15,000 |
Break-Even Point Formula With Target Profit
The target-profit formula adds desired operating profit to fixed costs before dividing by contribution margin per unit. This tells managers how much volume is required to achieve more than simply covering expenses.
Required units = (Fixed costs + Target operating profit) ÷ Contribution per unit
Assume fixed costs are $45,000, desired operating profit is $15,000, and contribution per unit is $30.
Required units = ($45,000 + $15,000) ÷ $30 = 2,000 units.
The model therefore requires 500 additional units beyond the 1,500-unit break-even threshold to generate $15,000 in operating profit. Income taxes and financing costs may require further adjustments depending on how the target is defined.
How Price Changes Affect the Break-Even Point
Price changes affect the break-even point by changing contribution margin per unit. A lower selling price reduces contribution when variable costs remain unchanged, requiring more sales to cover the same fixed expenses. A higher price increases contribution but may reduce demand.
Suppose fixed costs are $24,000 and variable cost is $60 per unit.
The table demonstrates the mathematical effect of different prices. It does not establish which price is commercially best. Businesses must evaluate whether customers will purchase enough units at each price to achieve the expected result.
For additional pricing context, see Pricing and Profit Margins in Distribution.
| Selling price | Contribution per unit | Break-even quantity |
|---|---|---|
| $80 | $20 | 1,200 |
| $90 | $30 | 800 |
| $100 | $40 | 600 |
| $110 | $50 | 480 |
Break-Even Point for Multiple Products
Multi-product break-even analysis uses the weighted average contribution margin of the expected sales mix. A business selling products with different prices and costs cannot reliably apply a single-product formula to all merchandise without adjusting for the mix.
Suppose a distributor sells two products:
Weighted contribution per unit = (20×0.60) + (40 × 0.40) = $28.
If fixed costs total $56,000, the company needs 2,000 total units at the assumed mix to break even. This translates into approximately 1,200 units of A and 800 units of B. If actual sales shift toward the lower-contribution product, the true break-even quantity increases.
A more complex distributor may prefer calculating break-even using a blended revenue contribution ratio. The key requirement is ensuring the ratio reflects realistic sales composition rather than a simple average of unrelated product percentages.
| Product | Unit contribution | Expected share of units |
|---|---|---|
| Product A | $20 | 60% |
| Product B | $40 | 40% |
What Is Margin of Safety?
Margin of safety measures how far actual or forecast sales exceed the break-even sales level. It indicates how much revenue can decline before the business reaches the modeled loss threshold. A larger margin of safety provides more room for ordinary fluctuations.
Margin of safety (%) = (Actual sales − Break-even sales) ÷ Actual sales × 100
If actual monthly revenue is $200,000 and break-even revenue is $150,000:
Margin of safety = $50,000 ÷ $200,000 × 100 = 25%.
Under the model assumptions, sales could decline by 25% before reaching break-even. The calculation should be updated if product margins, fixed expenses, or sales mix change.
Break-Even Analysis vs. Cash-Flow Break-Even
Accounting break-even and cash-flow break-even are not necessarily the same. Accounting profit can include noncash expenses such as depreciation, while cash flow depends on actual payments, collections, inventory purchases, and debt obligations. A distributor can report operating profit while experiencing a cash shortage.
For example, a wholesaler may sell merchandise on Net 45 terms while paying suppliers in 15 days. It can reach accounting break-even but still require financing for inventory and accounts receivable. Increasing sales may initially worsen that financing requirement.
Startup planning should therefore include both operating break-even and a cash-flow forecast. The Distribution Business Startup Cost Guide explains the importance of inventory, operating runway, and working capital.
Common Break-Even Formula Mistakes
Common break-even mistakes include excluding relevant costs, mixing time periods, overstating contribution margins, and assuming demand remains constant at every price. Each can make the calculated threshold appear easier to achieve than reality supports.
Businesses should also recognize capacity limits. If a company can fulfill only 1,000 units per month without renting additional space, a break-even target of 1,500 units may require new fixed costs. The calculation must then be updated to reflect the next operating range.
Another issue is treating break-even volume as a sufficient business goal. A company needs profits for reinvestment, financing obligations, owner returns, and unexpected expenses. Break-even is a minimum financial threshold, not proof of long-term sustainability.
Final Takeaway
The break-even point formula provides a practical answer to how much a business must sell before its operations cover their costs. It can be expressed in units or sales revenue and extended to model target profit, pricing decisions, and changes in expenses.
Businesses should use break-even analysis alongside demand forecasting and cash-flow planning. The calculation is most valuable when the underlying costs and assumptions are realistic and updated regularly. For distributors, the ability to finance inventory and collect customer payments remains just as important as reaching an accounting profit threshold.
Frequently Asked Questions
- What is the break-even point formula?
- Break-even quantity equals fixed costs divided by selling price minus variable cost per unit. The result identifies the units needed to cover modeled costs.
- How do you calculate break-even sales revenue?
- Divide total fixed costs by the contribution margin ratio. For example, fixed costs of $20,000 and a 40% contribution ratio produce break-even sales of $50,000.
- What happens at the break-even point?
- Total revenue equals total costs under the model, so operating profit is zero. The business is neither making an operating profit nor recording an operating loss within the specified assumptions.
- Can the break-even point be zero?
- Yes, in a simplified model with no fixed costs and positive contribution per unit, the break-even quantity can be zero. Most established businesses still incur expenses or commitments that need to be considered.
- What if variable cost exceeds selling price?
- Each additional unit creates a negative contribution. Increasing sales cannot cover fixed costs under unchanged pricing and cost assumptions.
- Is break-even the same as profitability?
- No. Break-even represents zero modeled profit. A profitable business earns more than its total relevant costs over the period.